Build your own dashboards
Every monitor now has a Dashboards screen, where you build the analyses your team needs, with charts, numbers and tables placed and sized however you like, each showing exactly the slice of data you choose. The Report charts are there too, as ready-made dashboards, and they serve as a starting point for your own.
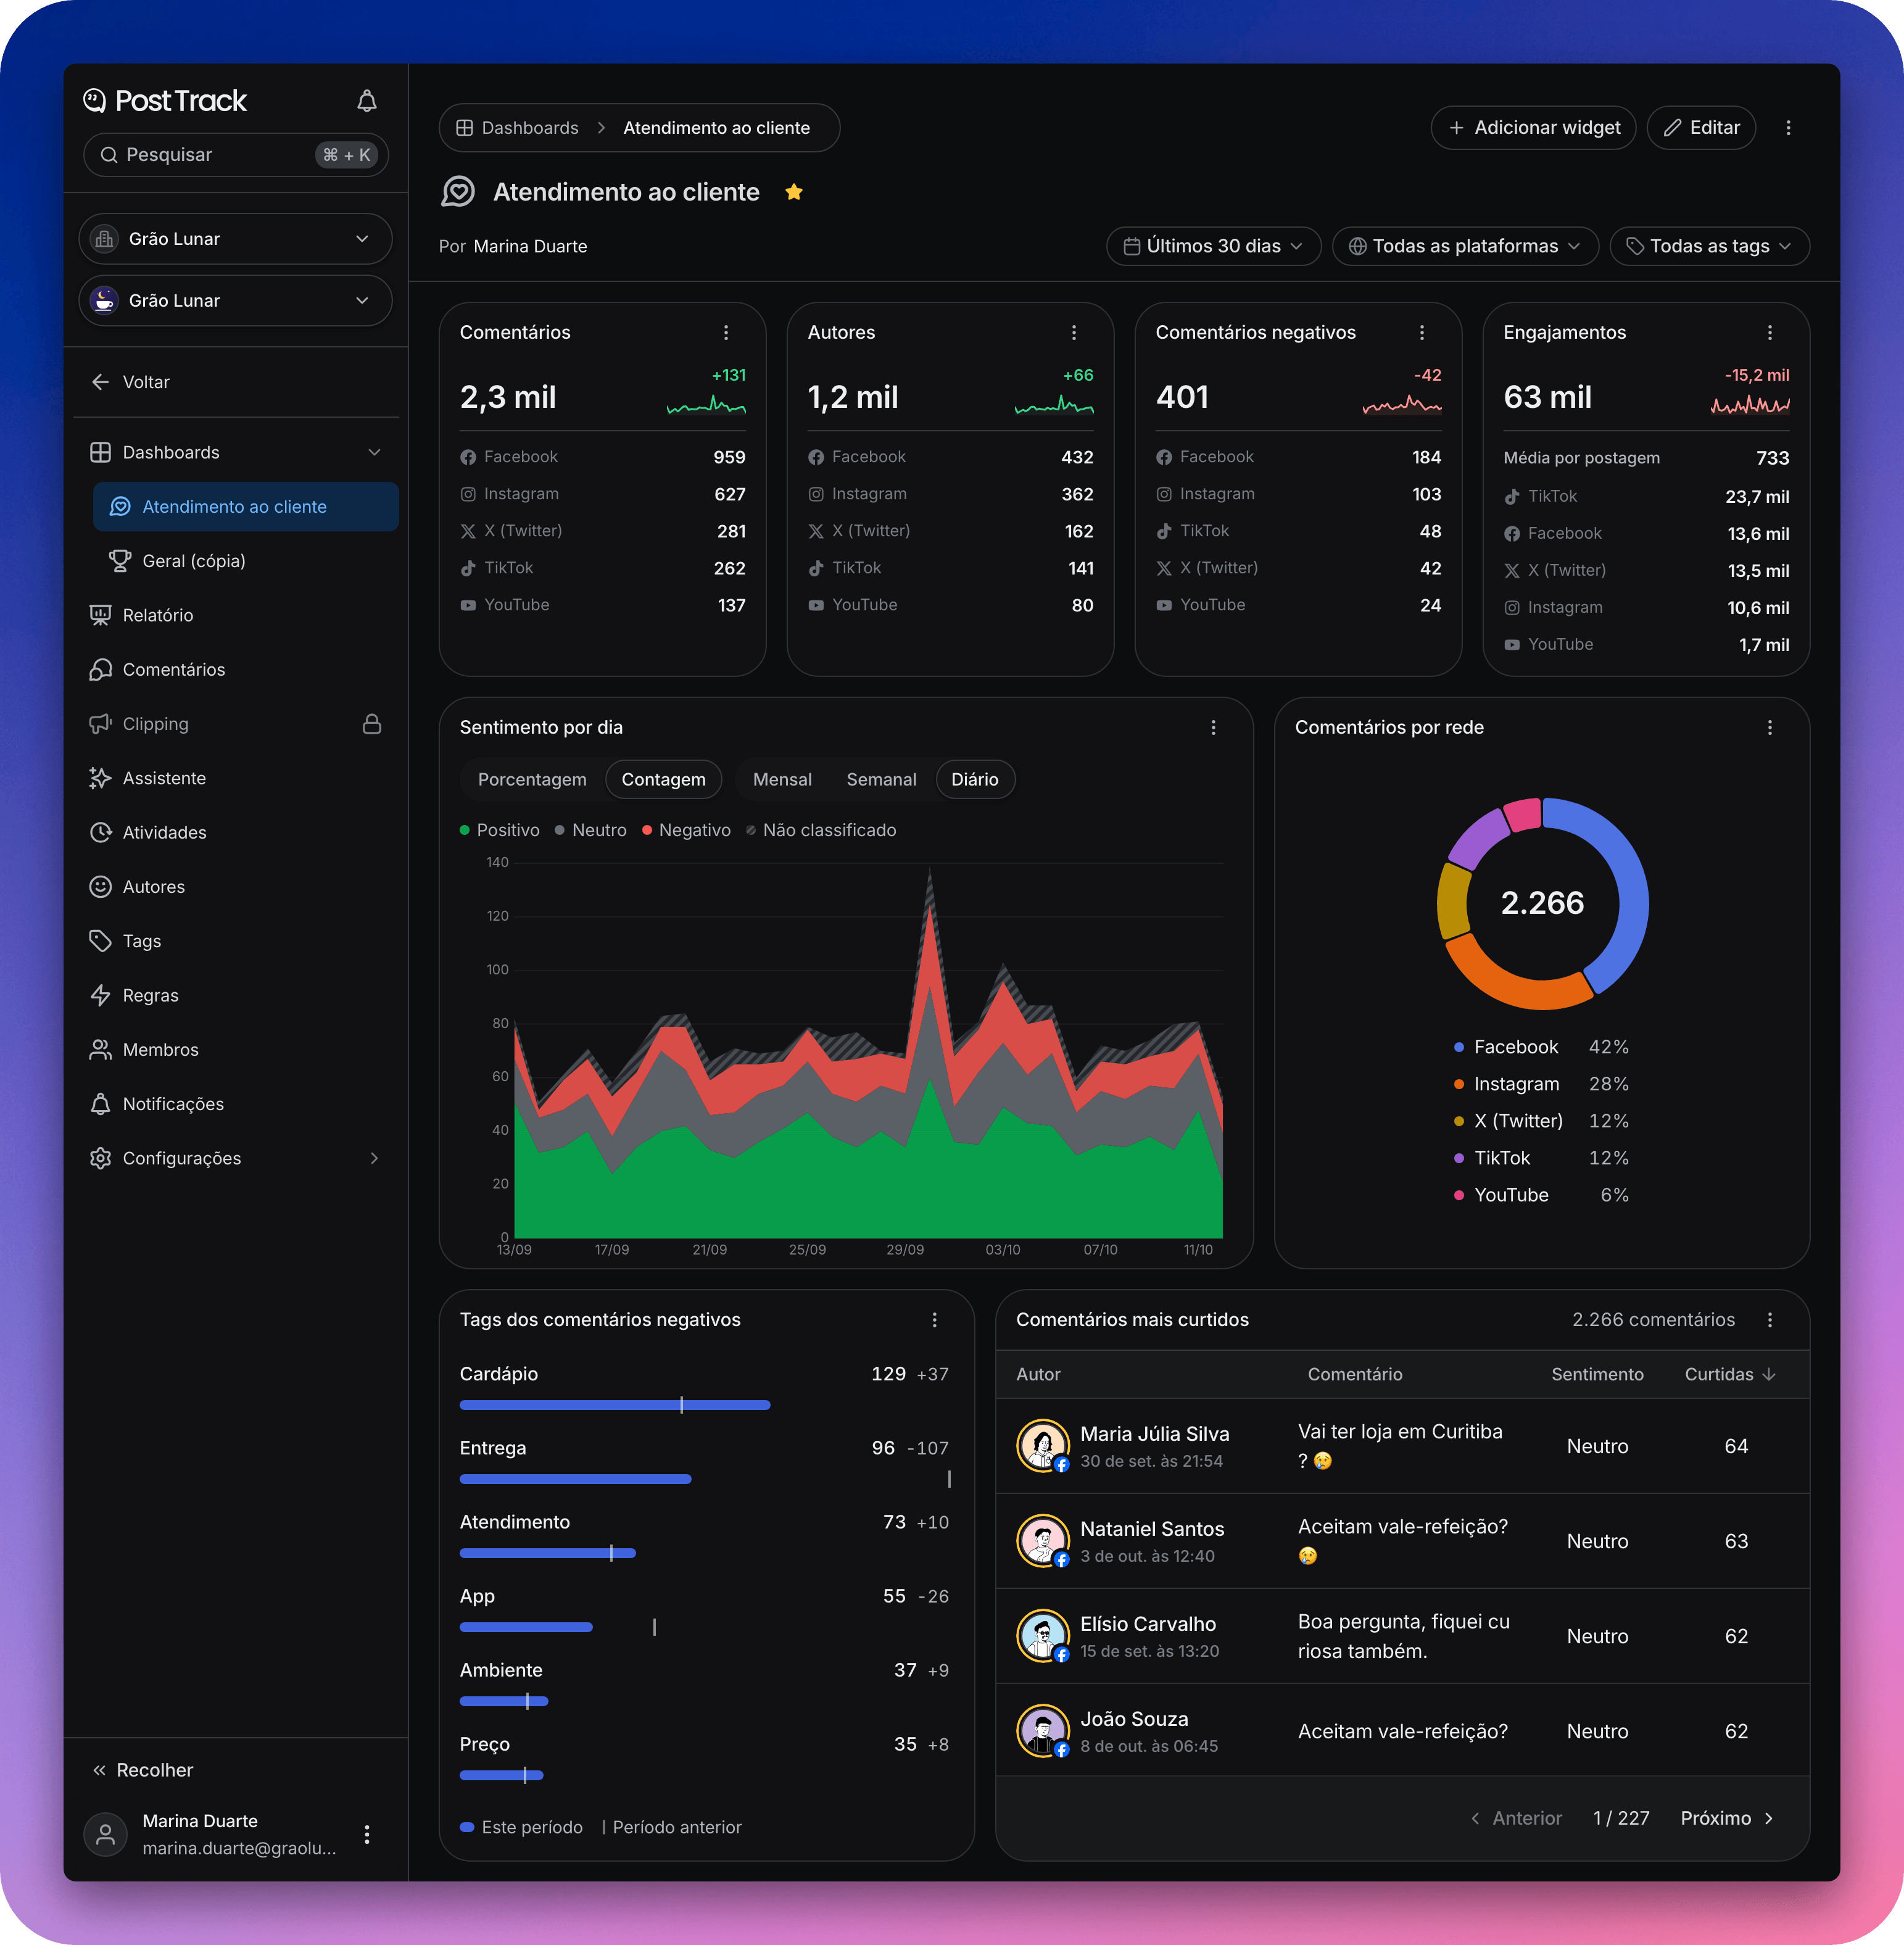
Where to find it
In the monitor's sidebar, Dashboards sits right above Report. The list shows each dashboard with its icon, how many widgets it has and of what type, who created it and when.
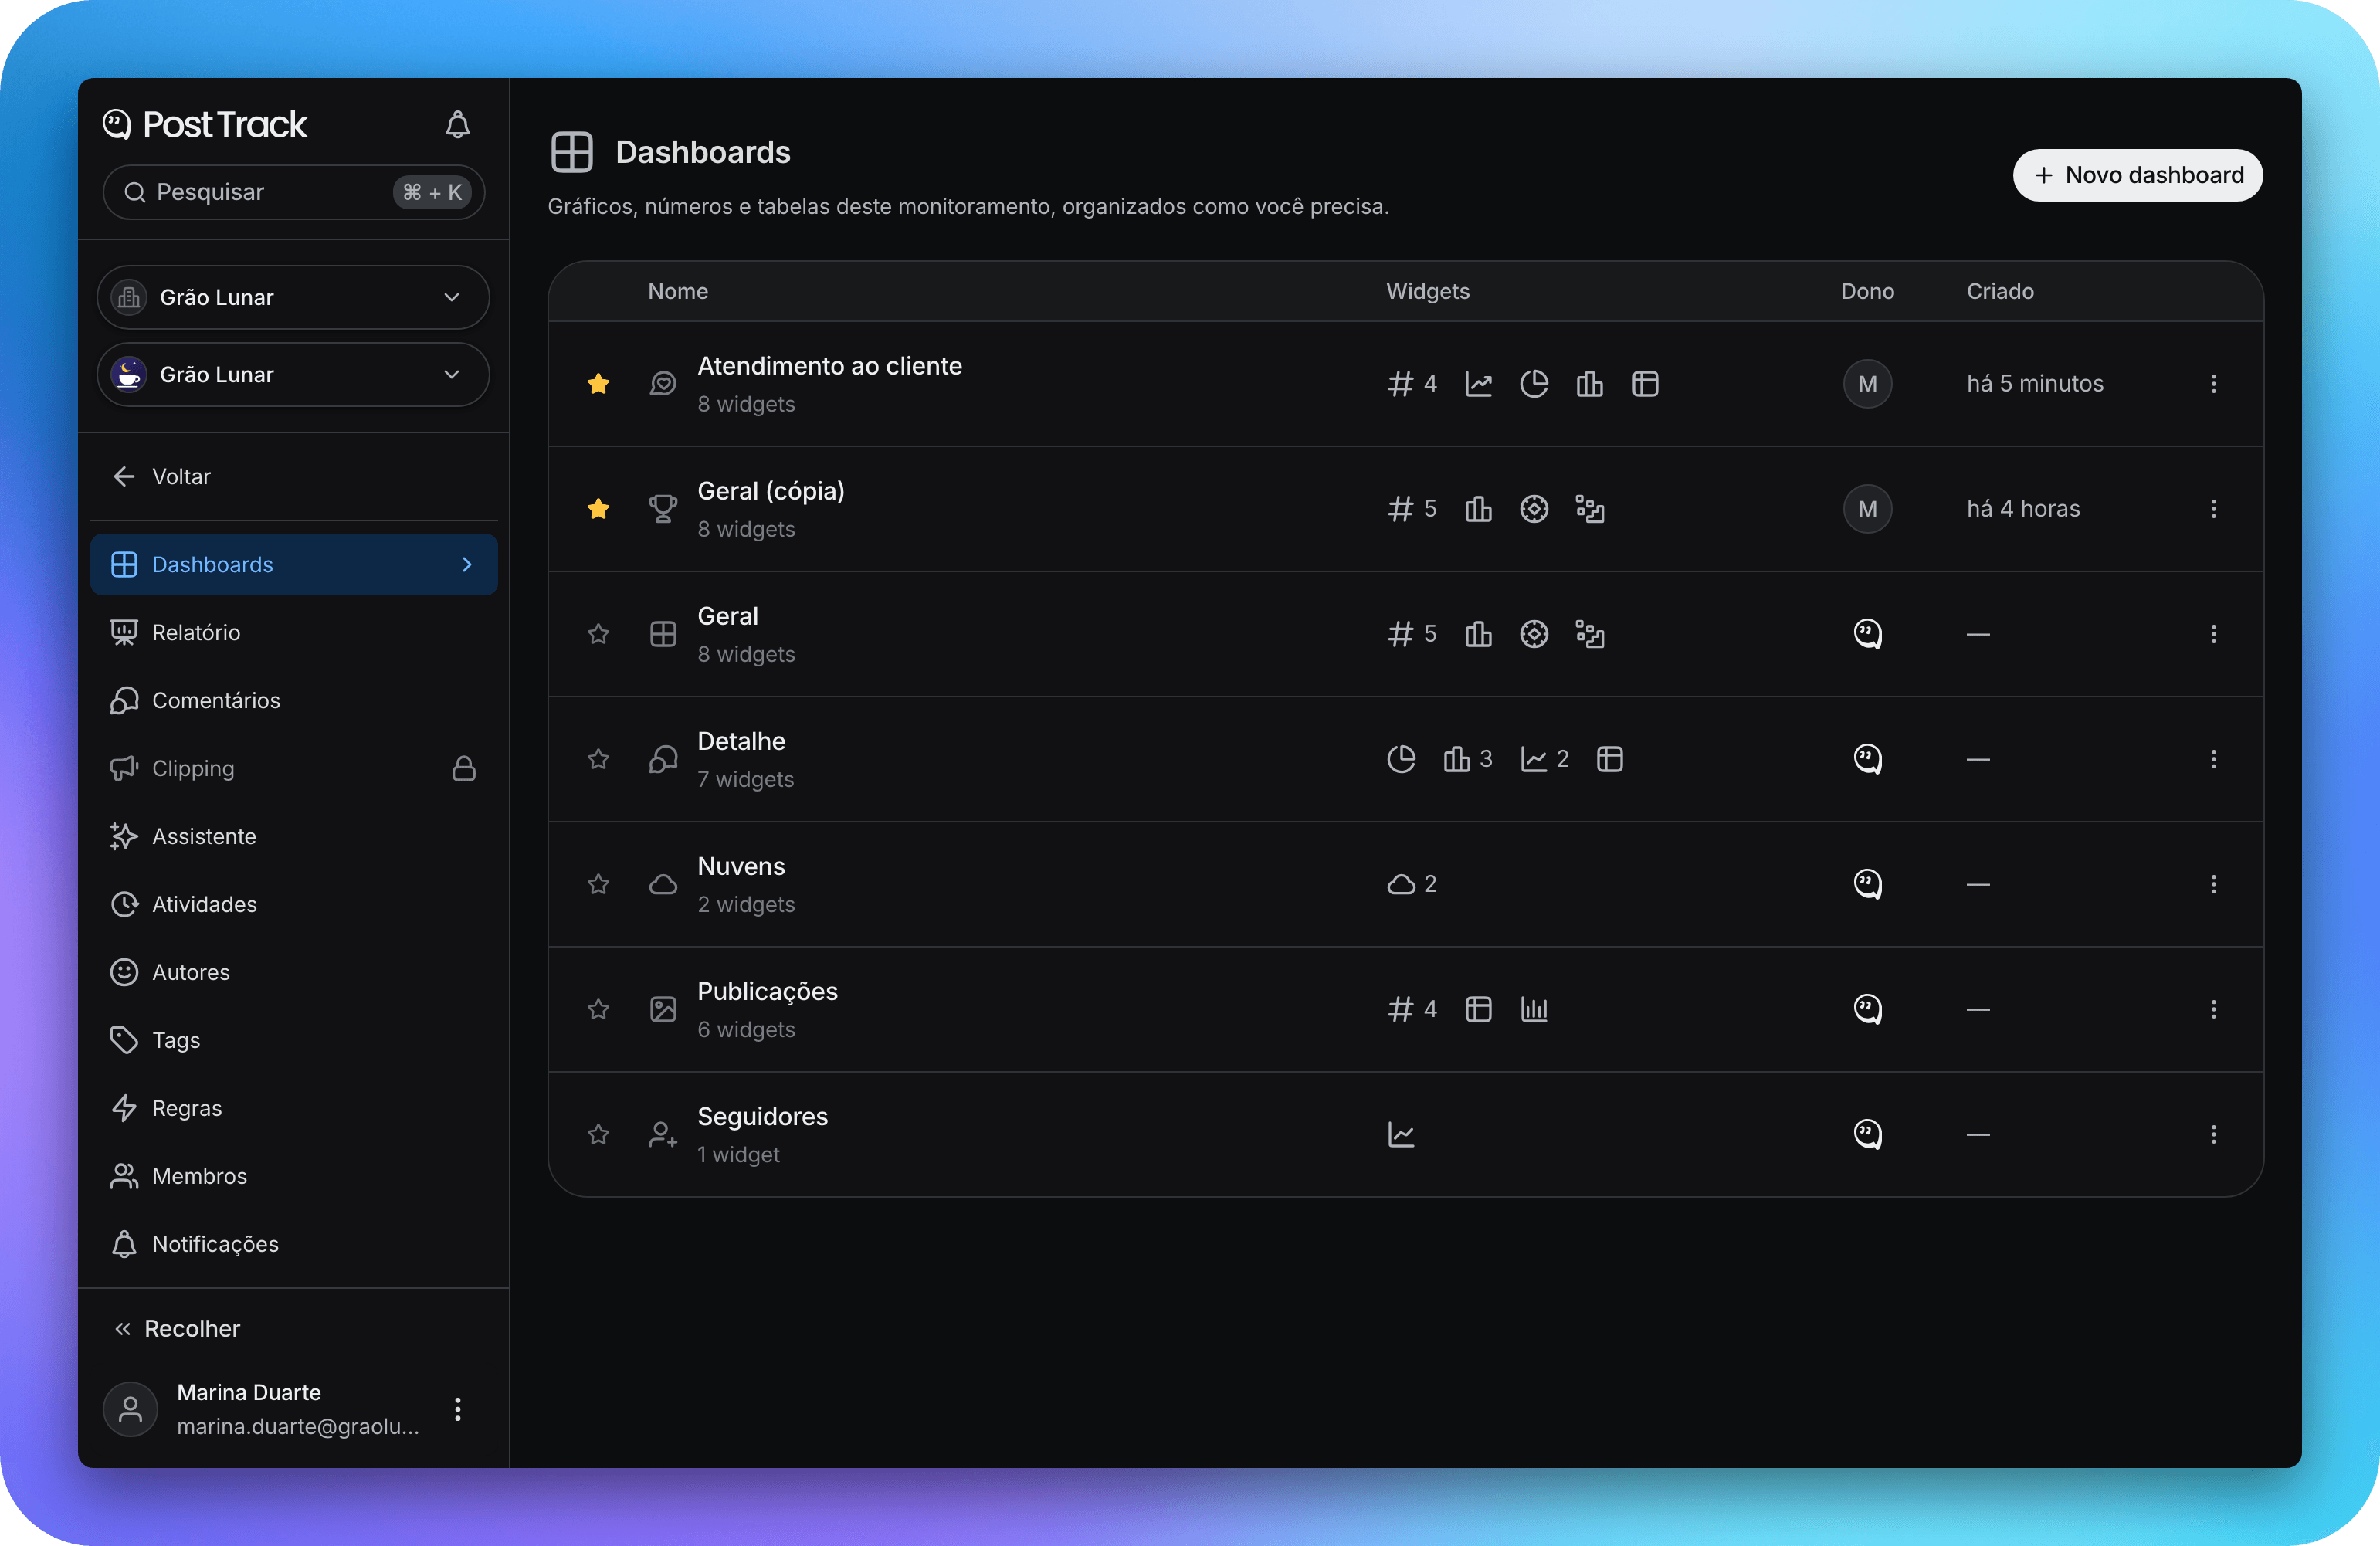
Ready-made dashboards
Every monitor comes with five ready-made dashboards, one for each Report tab (General, Detail, Clouds, Publications and Followers), with the same charts in the same order. They are maintained by Post Track and can't be edited. To adapt one, click Duplicate and edit the copy, which becomes yours.
Build your own
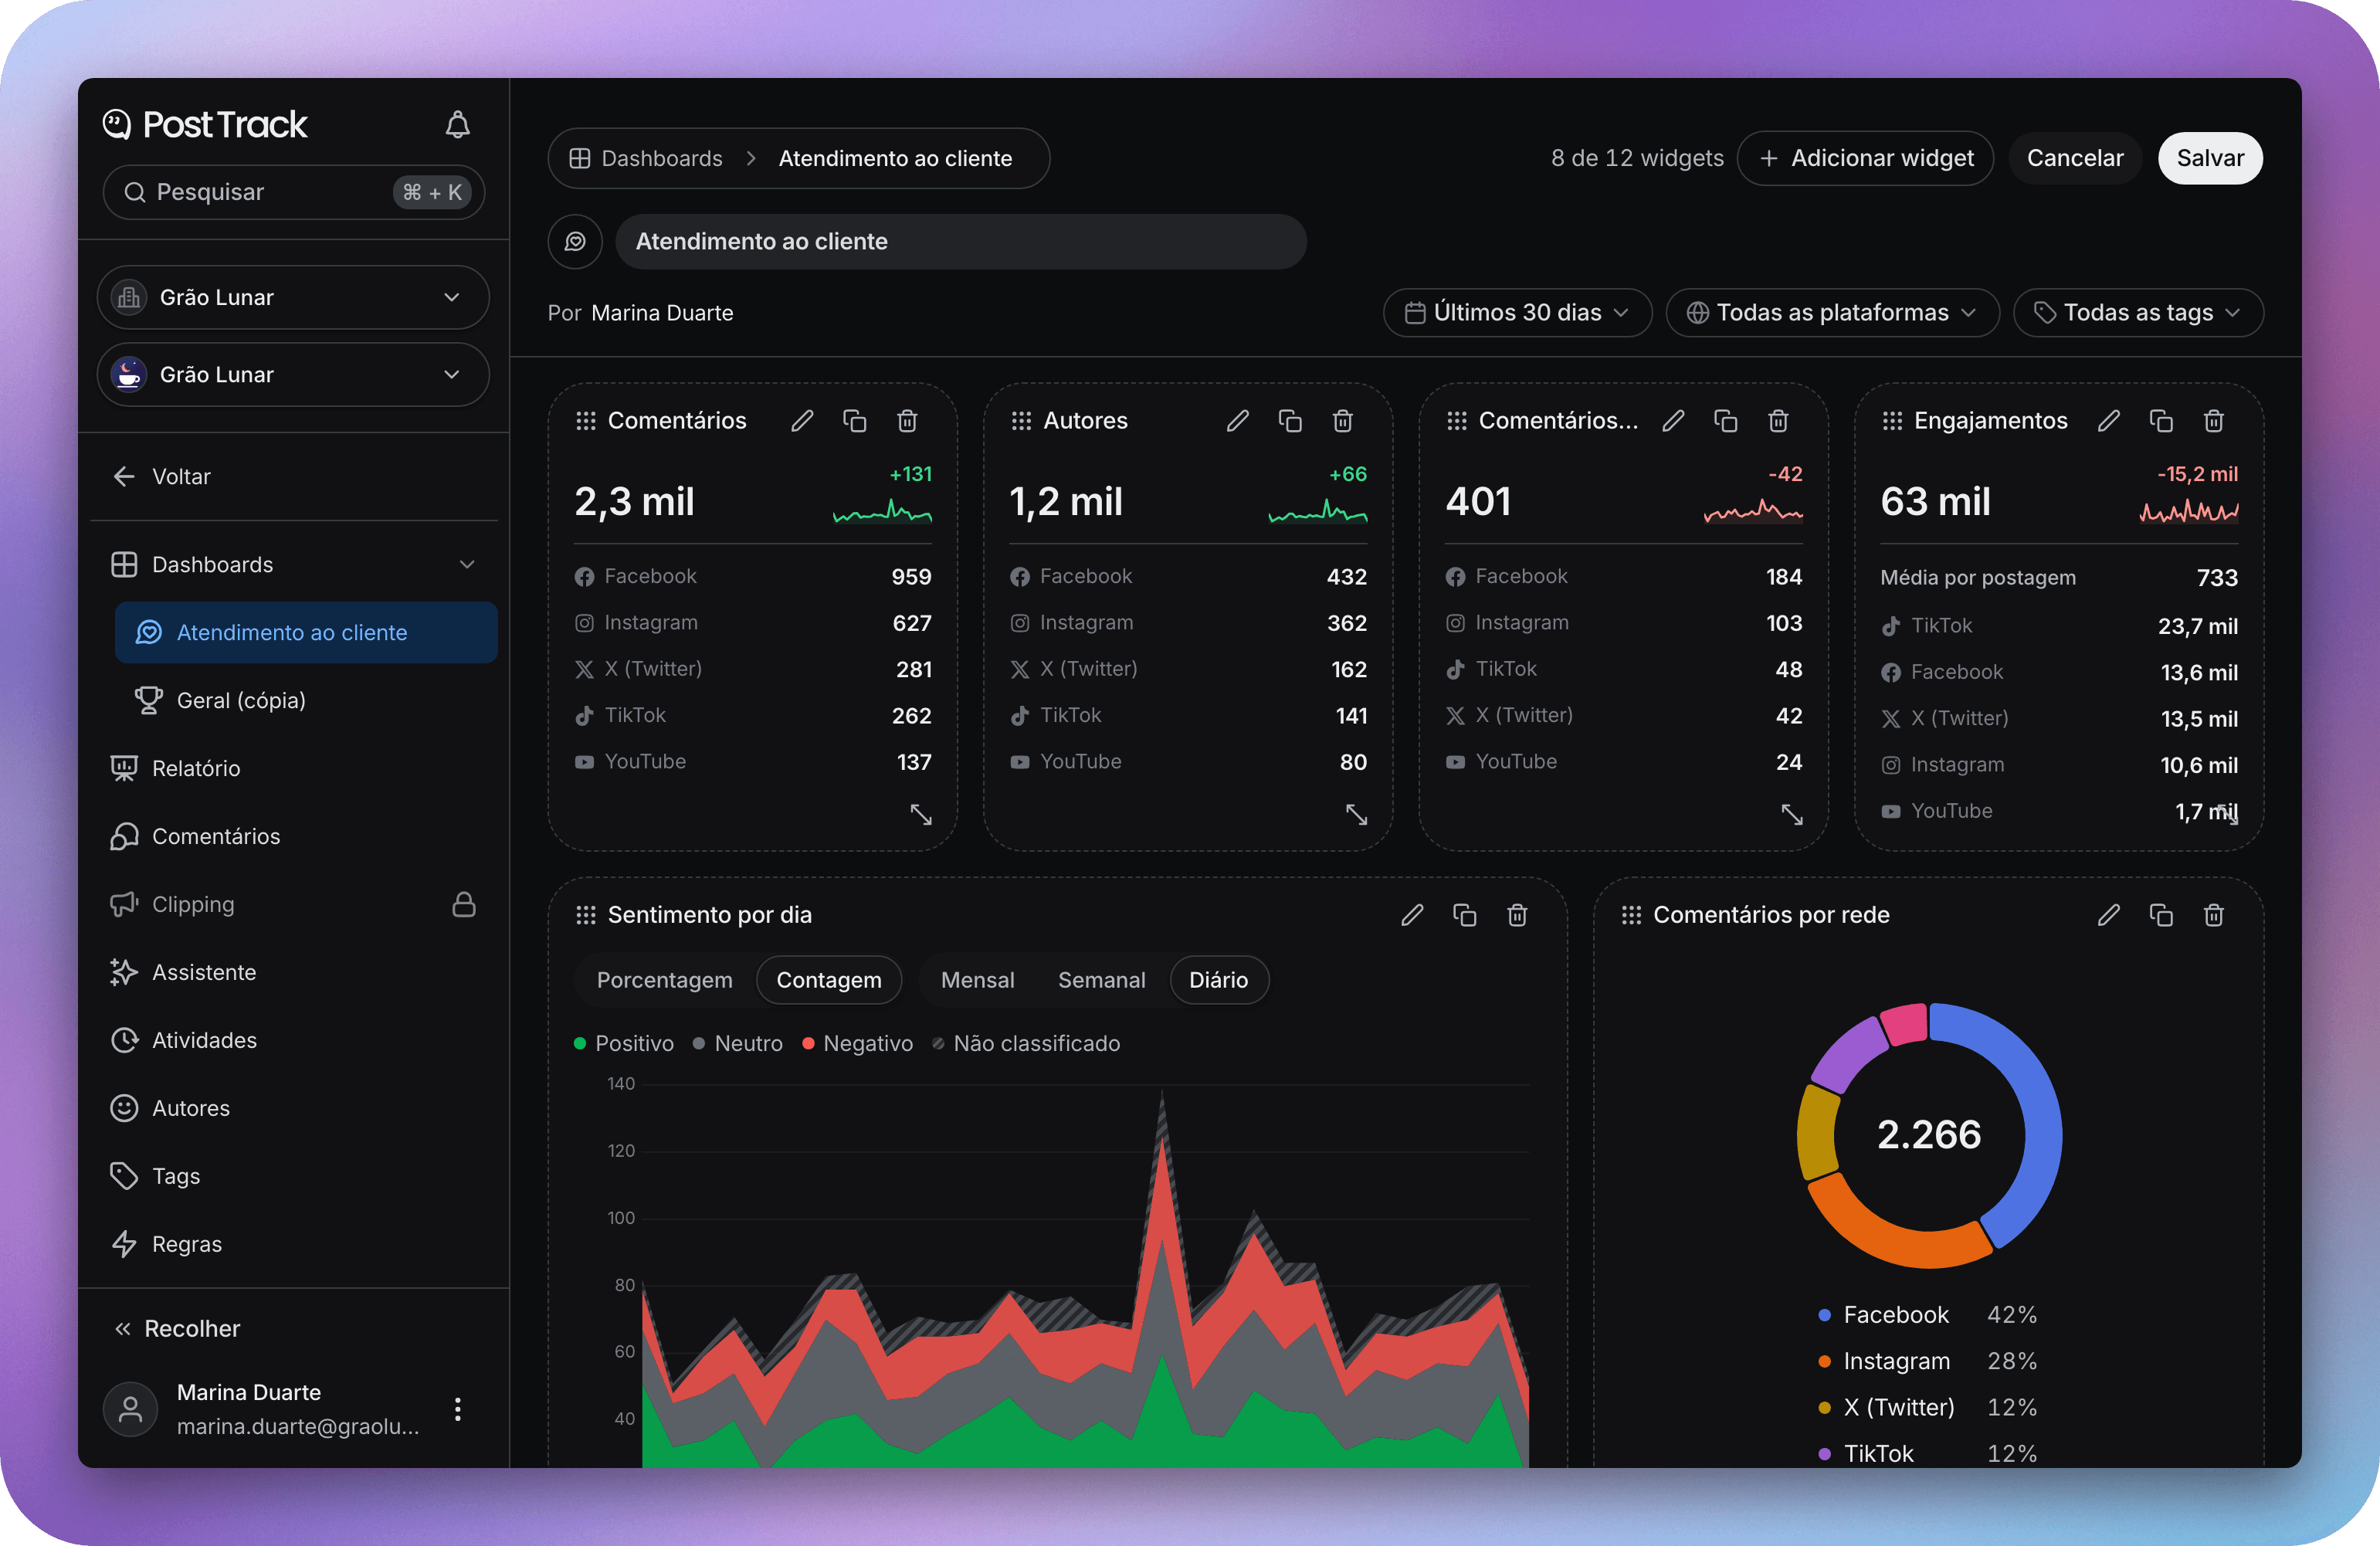
Click New dashboard, give it a name, pick an icon and add widgets, up to 12 per dashboard. In Edit mode, you can drag widgets to reorder them, resize each one, and duplicate or delete them. Nothing is saved until you click Save, and Cancel (or Esc) puts the dashboard back the way it was.
Outside edit mode, each widget's menu also lets you edit, duplicate or delete just that widget, and the change is saved right away.
A query for each widget
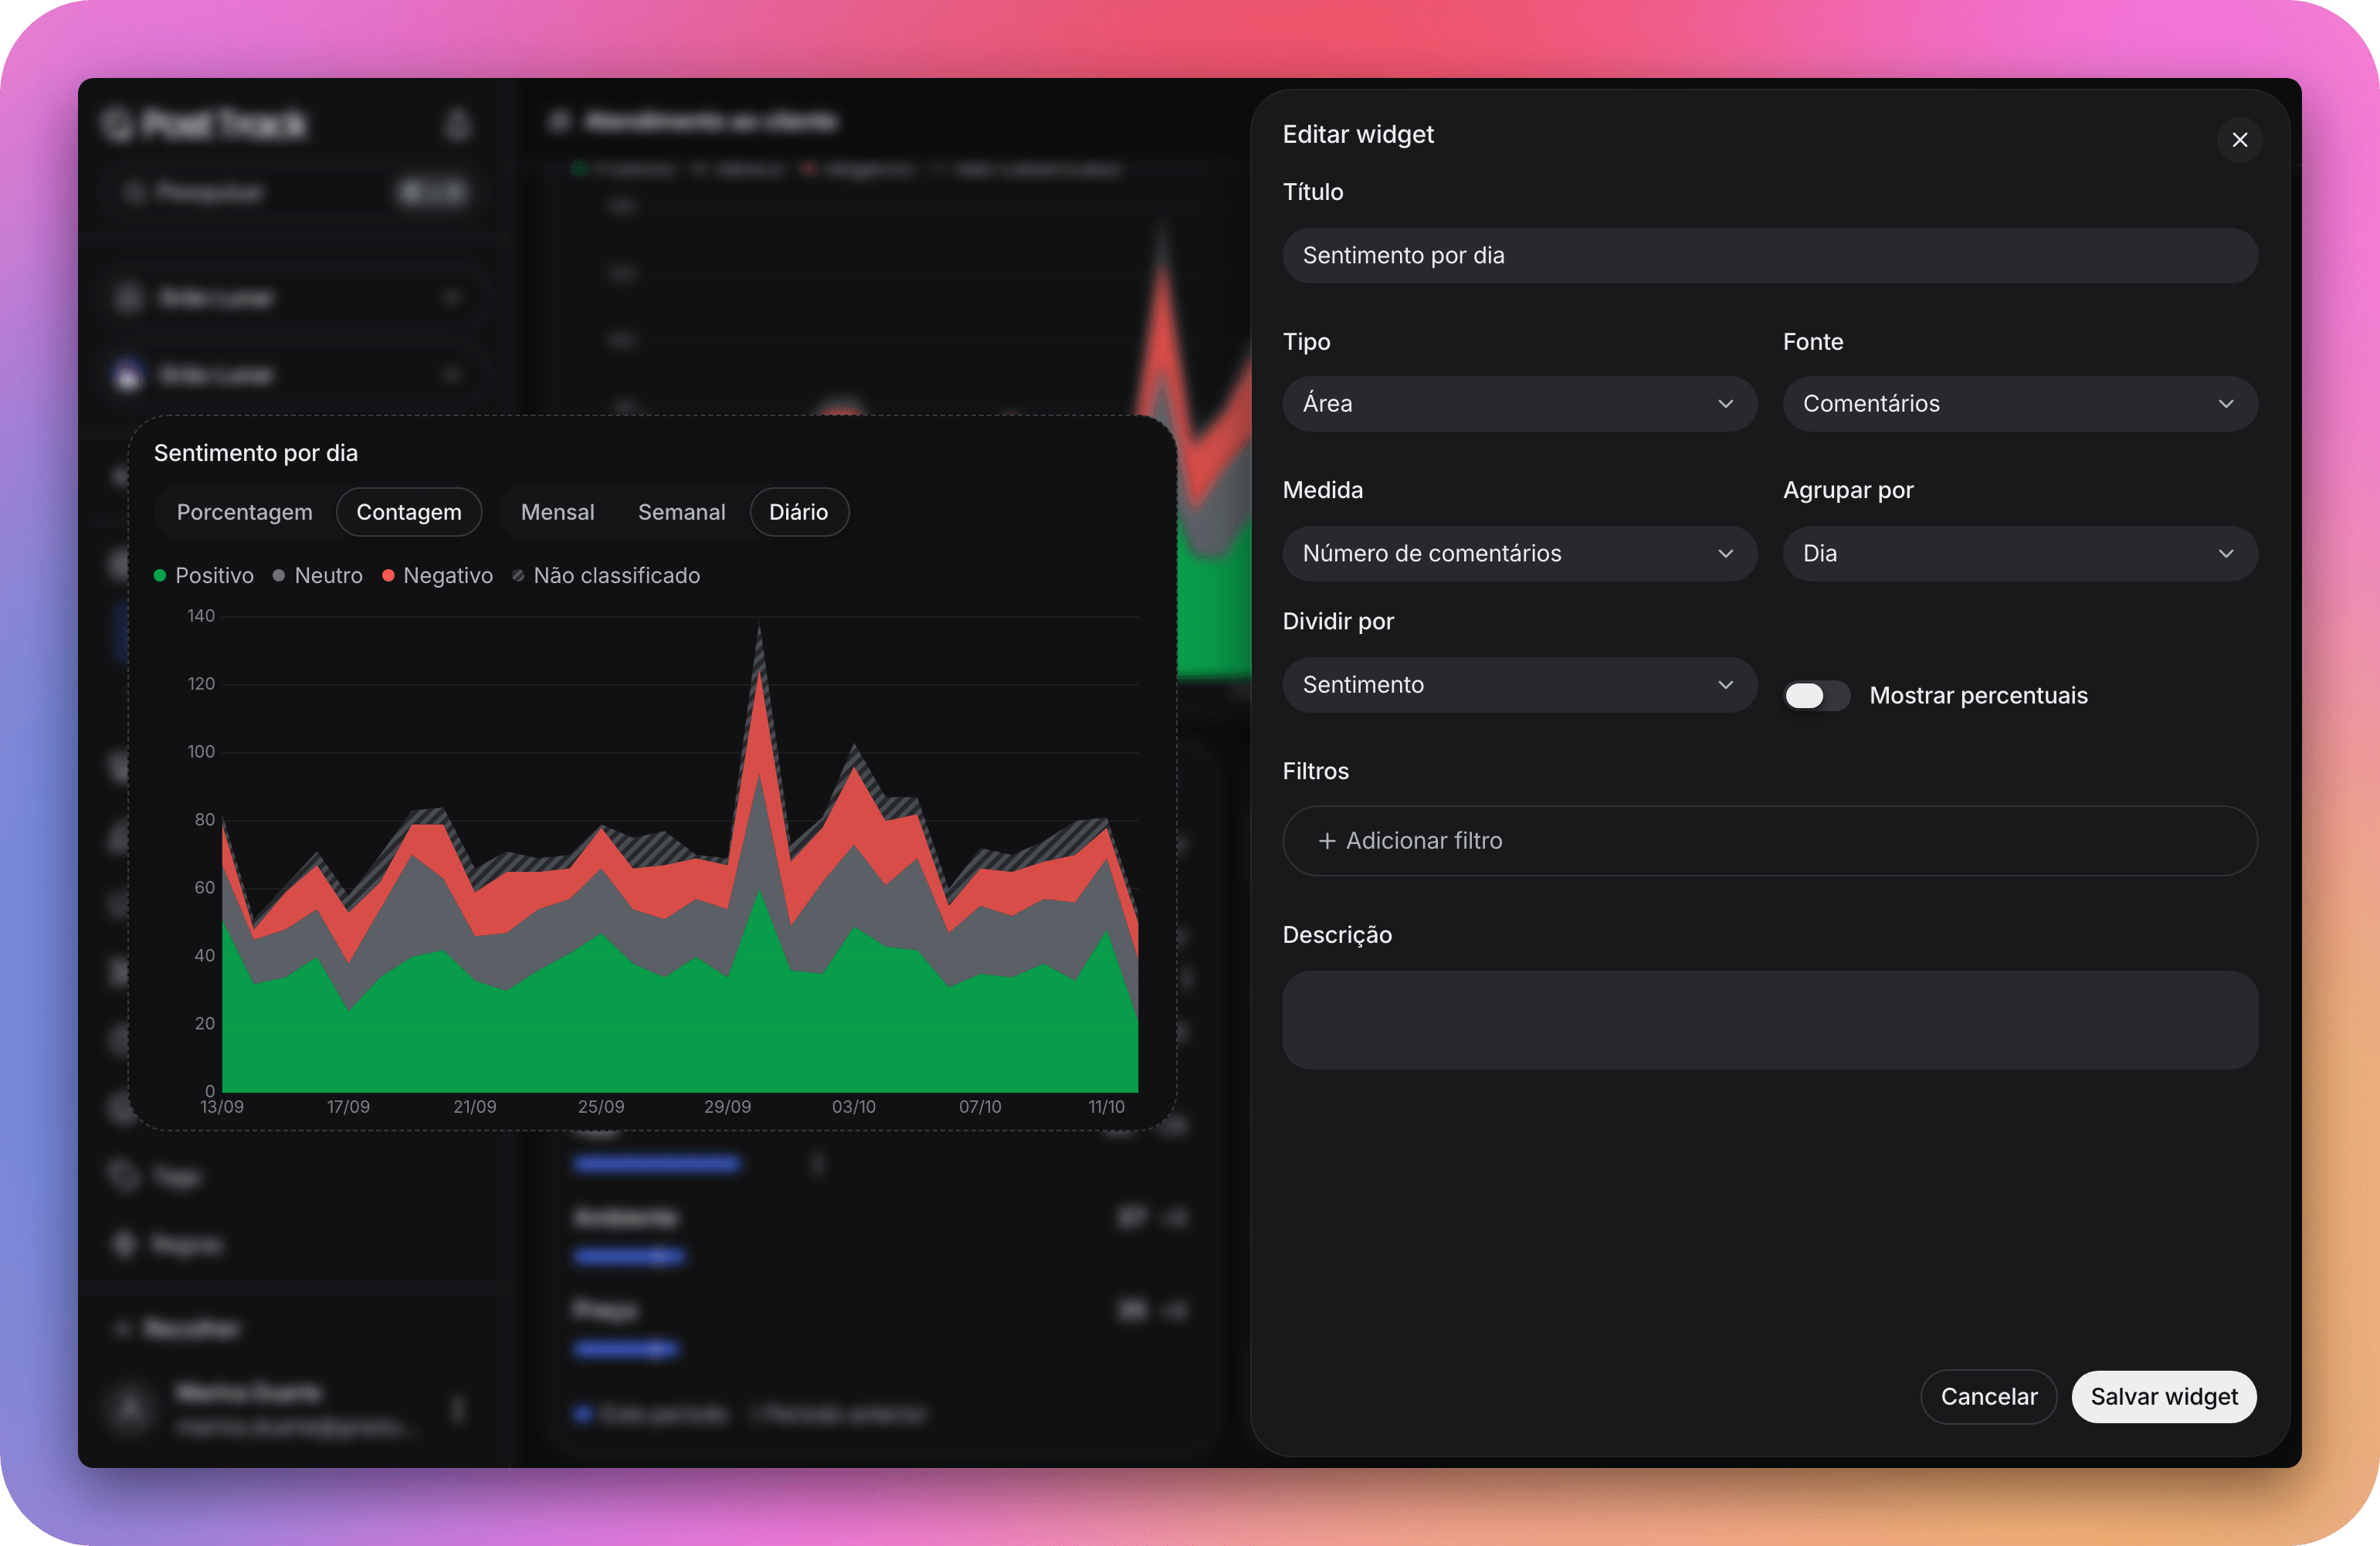
When you add or edit a widget, a panel opens next to the dashboard with a preview that updates with every change. In it, you choose:
- Source — the monitor's comments, posts or followers.
- Type — line, area, bars over time, bars by category, pie, number, table, text, tag profile, tag map, target tags, and word or emoji cloud.
- Measure — the number of comments or authors, or the total and average of the posts' likes, comments, shares, views and engagement.
- Group by — day, week or month, or else tag, sentiment, platform, author, post or account.
- Split by — a second dimension, such as sentiment or platform, that becomes a line or a color for each value.
- Filters — which apply to that widget only.
The number and bars-by-category widgets show how much each value changed compared to the previous period of the same length. In the table, you pick the columns and drag them to reorder. And the text widget accepts Markdown, so you can leave context and notes for whoever opens the dashboard.
Dashboard filters
At the top of the dashboard, the period, platforms and tags apply to every widget, on top of each widget's own filters. The dashboard opens on the last 30 days, and you can pick a period of up to two years.
Changing these filters outside edit mode only affects your view, and the selection is kept in the page URL. Copy the link to show someone exactly what you're seeing. In edit mode, Save stores the filters on screen as the dashboard's own.
Favorites
Star the dashboards you use most. They show up first in the list and stay within reach in the sidebar, under Dashboards. The star is yours alone and doesn't change the dashboard for the rest of the team.
Who can view and who can edit
Anyone who can view the Report can view the dashboards. That covers the monitor's Owner, Admin and Viewer. Only the owner and the admin can create, edit, duplicate and delete them.
Availability
Ready-made dashboards are included in every plan. Custom dashboards depend on the project's plan. You get up to 5 per monitor on Premium, 10 on Ultimate and unlimited on Enterprise. Free doesn't include custom dashboards. When you reach the limit, the list itself shows what the next plan allows, along with the Increase my limit button.
If the project moves to a plan with a lower limit, no dashboard is lost. The existing ones still open and can still be edited, you just can't create another one until you're below the limit.
For now, dashboards are available on the web.
What about the Report?
The Report stays where it is. New analysis features will now arrive as dashboard widgets, which will gradually take its place.